
Final Placement Prediction With Machine Learning Using Python
Predict the final placement position of players in a battle royale shooting game from 1st place to 100th place.
.jpg)

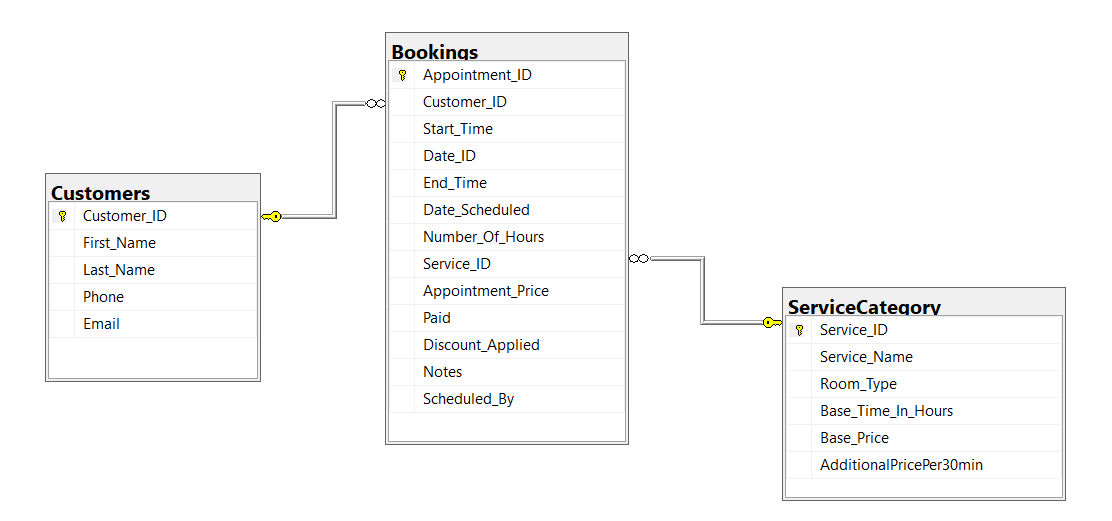
The original dataset contained the following columns:
It was then normalized and transformed into the following tables:
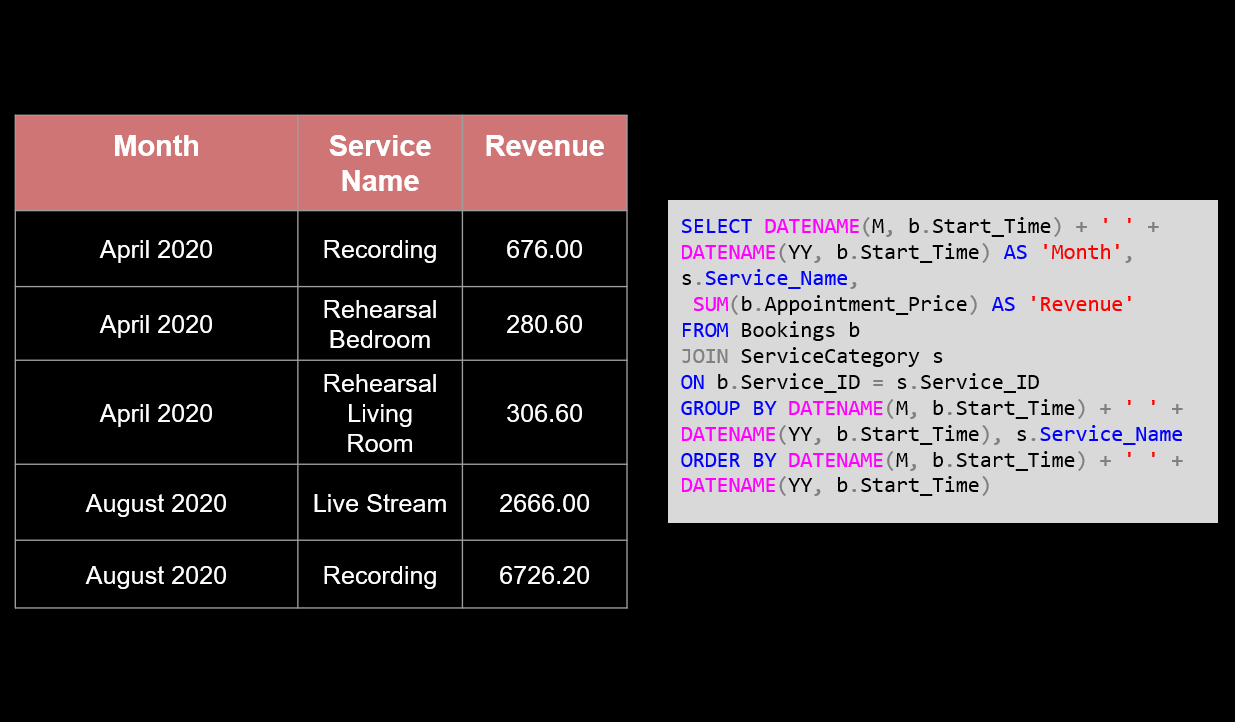
Revenue By Service Type By Month
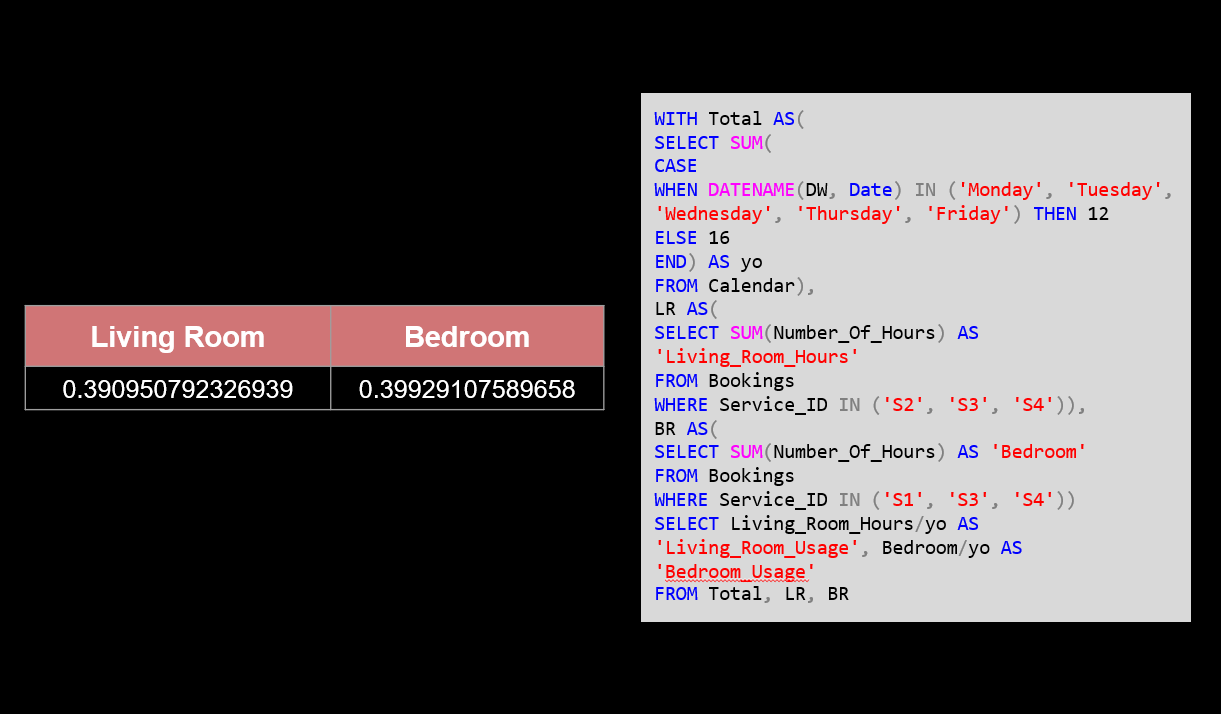
Occupancy Rate By Room
.png)
Predict the final placement position of players in a battle royale shooting game from 1st place to 100th place.
.png)
Create a dashboard in Power BI showing occupancy rates and hotel KPIs. Dataset from Kaggle.
.png)
Create a dashboard in Excel using a music studio dataset. Dataset provided by Tonehouse Studios.